| |
Temperature Measurements 1850 - 2019
PawPlot - P.Duinker
 |
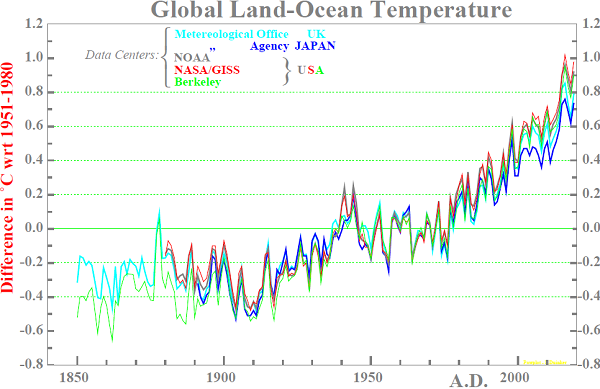
| The horizontale line through 0.0 agrees very well with 14.0 °Celsius. The title of the figure and the legends are clickable and lead to additional information. For a pdf-file of the graph click here. | |
The figure shows the average yearly land-ocean temperature changes from 1850 up to the present as measured by five large data centres as indicated. The temperature differences – plotted along the vertical axis – are calculated with respect to the average temperature of the thirty year time interval 1951 - 1980.
| |
