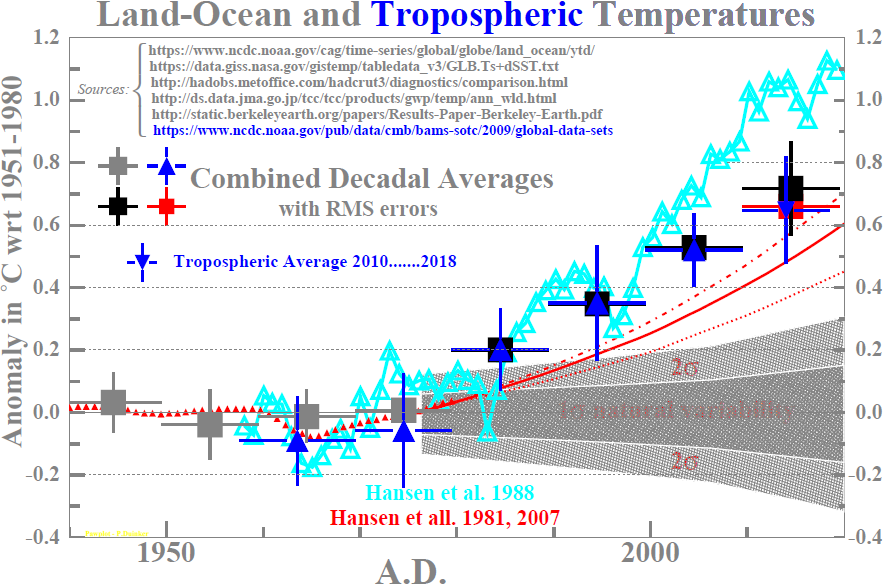
1980 - Measurements versus Natural Noise - 2019
PawPlot - P.Duinker
 |
Source: Climate Indicators NOAA/NCDR. The title, the sources, the text "Combined Decadal Averages", the associated data points and the gray hatched areas are clickable and lead to the underlying data and additional information. Clicking on the Hansen et al. references brings the original publications in view. For a pdf-file of the figure click here. |
The expected value for the present decade 2010 - 2019 is shown with the red rectangle. The value has been estimated from a figure from the 2007 publication "Dangerous human-made interference with climate: a GISS modelE study". The conclusion of that paper reads:
The principal implication is that avoidance of dangerous climate change requires the bulk of coal and unconventional fossil fuel resources to be exploited only under condition that CO2 emissions are captured and sequestered.
Remarks
1. The calculated deviation of the averaged land-ocean and troposheric measurements with respect to the natural variability hypothesis results in a chi-square value for the last 38 yeats of 42.7 for 4 degrees of freedom corresponding to a probability of 1.5·10-8, almost a 6σ effect.
I thank Dr. W. Metzger – former colleague from the Radboud University in Nijmegen, the Netherlands – for providing me with these numbers.