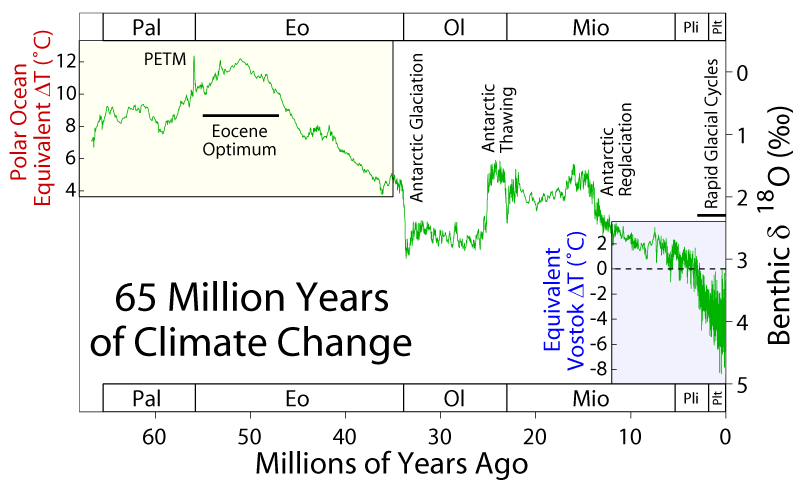
The graph shows along its vertical scale a proxy - Benthic δ18O(‰) - for the deep ocean temperature over a period of some 65 million years. This proxy is the measured ratio of the stable isotopes of oxygen as found in the hardened fossil shells of benthic foraminifera taken from ocean sediments. High values indicate the low temperatures of the recent glacial cycles (blue area of the graph). The horizontal dashed line in that region is drawn at the global temperature of about 14 °C of the period 1951-1980. The ice free world wihout a permanent iceplate at the Southpole of the Eocene ending some 32 million years ago is indicated by the yellow region of the graph.