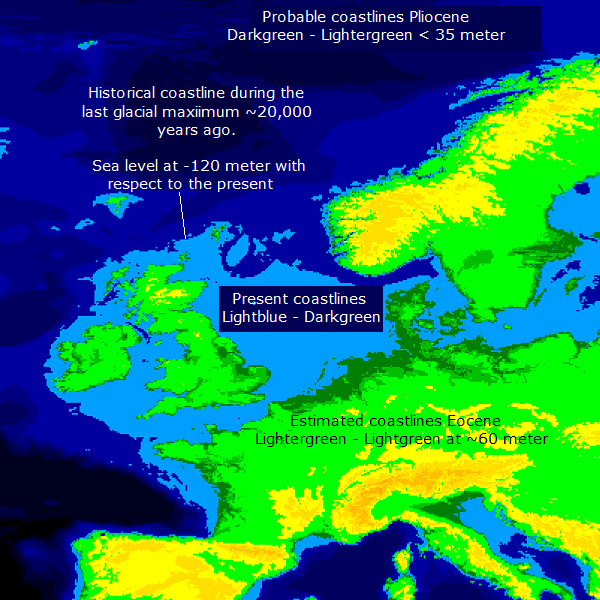
Source: U.S. Geological Survey Open-File Report 96-000
The line of the lightest hue of blue bordering the darker ones is at -120 m below sea level. This line is also the estimated sea level at the Last Glacial Maximum (LGM) some 20,000 years ago. The other coastlines - the present one and the historical ones of the Pliocene and Eocene - are as indicated in the figure. The temperature during the warmer parts of the Pliocene was some 5°C higher in the Netherlands than at present. With repect to the present global average however it is only 2.5±0.5°C away.
For the color defenitions put the cursor on the word "Colorkey on the top-right of the figure.