"Lessen uit de geschiedenis van de aarde"
PawPlot - P.Duinker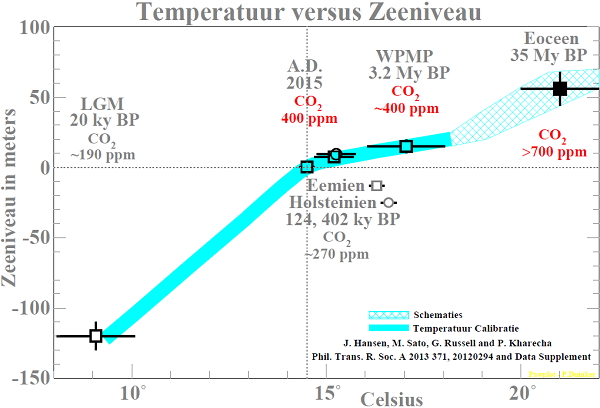 |
| Bron: "Climate sensitivity, sea level and atmospheric carbon dioxide, Hansen et al., 2013 . De tekst in de figuur en de titel zijn klikbaar en leiden naar meer informatie. Voor een website met de zeeniveau gegevens sinds 1880 klik hier en voor een video presentatie door J. Mitrovica "The Fingerprints of Sea Level Change" klik hier. |
From 15,000 to 10,000 years ago sea level rose by around 80m, an average of 1.6 m per century (Fairbanks, 1989). During some intervals rates of up to 5 m per century were reached (Clark et al., 2004).
These values cannot simply be applied to today’s situation. The ice sheets at that time were considerably larger, which means the melting regions on the margins were greater, allowing a greater flow of meltwater. In addition, due to Earth’s orbital cycles around the sun (Milankovich cycles; Ruddiman, 2000), the incoming solar radiation at high latitudes of the Northern Hemisphere was considerably stronger, a situation that cannot be directly compared with the global increase in greenhouse gas concentrations. These two factors suggest higher melting rates at the end of the ice age than during the present warming. The much slower warming at that time, by contrast, would suggest lower melting rates. In fact, the disappearance of ice sheets at that time for the most part kept pace with the gradual climate warming, so the assumption that ice masses would have melted significantly more rapidly with faster warming is quite plausible.